在德意志插队的日子(1)
下乡插队的第一站: @Vaihingen

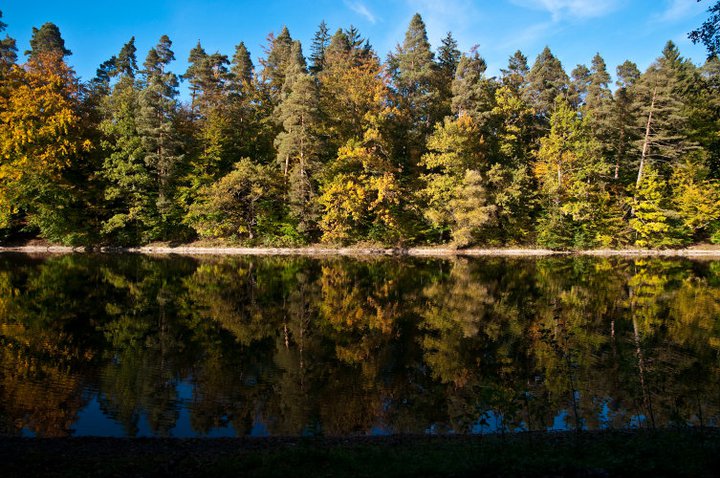
Bear See, 插队的日子里,有回吃完饭,溜达溜达就到了,Bear See
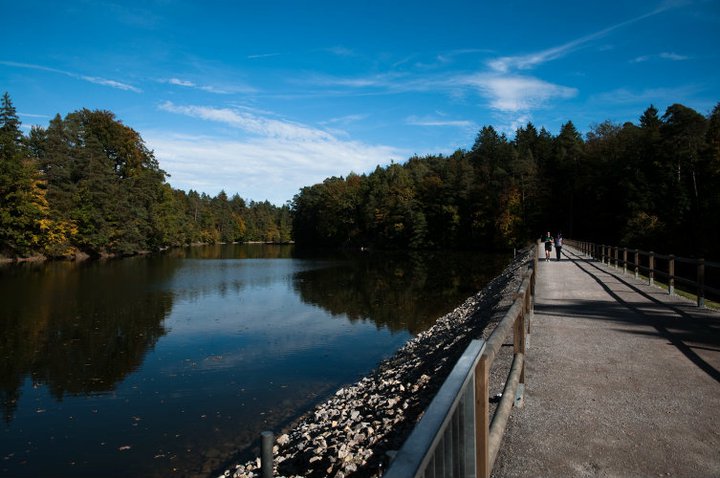
牛棚外的湖水,很安静吧
转林语堂的《孤崖一枝花》
转林语堂的《孤崖一枝花》,祝好友生日快乐。也是自勉
行山道上,看见崖上一枝红花,艳丽夺目,向路人迎笑。详细一看,原来根生于石罅中,不禁叹异。想宇庙万类,应时生灭,然必尽其性。花树开花,乃花之性,率性之谓道,有人看见与否,皆与花无涉。故置花热闹场中花亦开,使生万山丛里花亦开,甚至使生于孤崖顶上,无人过问花亦开。香为兰之性,有蝴蝶过香亦传,无蝴蝶过香亦传,皆率其本性,有欲罢不能之势。拂其性禁之开花,则花死。有话要说必说之,乃人之本性,即使王庭庙庑,类已免开尊口,无话可说,仍会有人跑到山野去向天高啸一声。屈原明明要投汨罗,仍然要哀号太息。老子骑青牛上明明要过函谷关,避绝尘世,却仍要留下五千字孽障,岂真关尹子所能相强哉?古人著书立说,皆率性之作。经济文章,无补于世,也会不甘寂寞,去著小说。虽然古时著成小说,一则无名,二则无利,甚至有杀身之祸可以临头,然自有不说不快之势。中国文学可传者类皆此种隐名小说作品,并非一篇千金的墓志铭。这也是属于孤崖一枝花之类。故说话为文美术图画及一切表现亦人之本性。“猫叫春兮春叫猫”,而老僧不敢人前叫一声,是受人类文明之束缚,拂其本性,实际上老僧虽不叫春,仍会偷女人也。知此而后知要人不说话,不完全可能。花只有—点元气,在孤崖上也是要开的。
点评:
林语堂先生在《孤崖一枝花》中写道:宇宙万类,应时生灭,必尽其性。是故花树开花,乃花之性,率性之谓道,有人看见与否,皆与花无涉……古人著书立说,皆率性之作,一则无名,二则无利,甚至有杀身之祸临头,然自有不说不快之势。
是啊,花树开花,只应时节,不论是闹市街头,荒郊野外,还是悬崖绝壁,不因有香而生,不因无香而死,自在地开放,自在地凋谢,与生俱来,无怨无悔。花开含情,情在隐约中;花落藏笑,笑在流光里。花事如人事,沐风栉雨,暑热寒气,愈显其娇艳明媚、多姿绚丽。花,有落寞孤独,有抱残守缺,一如昙花,生命何其短暂,也绝不放弃可以开放的时机。
花的况味是人生的况味。花有开放凋零,人有生老病死。凋谢的花让人看见美丽的消遁,逝去的人让人品咂生命的飘落。花有芬芳,人有灵性;花有七色,人有七情。花开是春梦,花落是秋意,人看花,会春心荡漾,会无端伤感;会豪情万丈,会愁绪满怀。青春的花,蓬勃、热烈、美丽、向上;暮秋的花,难免有几分枯萎、落寞、萧杀、凄凉。
席慕容诗歌《一棵开花的树》,所意味的是什么呢?有时候,花开本身,便是一份含泪的倾诉,一份无奈的守望:如何让你遇见我,在我最美丽的时刻……阳光下,慎重地开满了花,朵朵都是我前世的盼望……而当你终于无视地走过,在你身后落了一地的,朋友啊,那不是花瓣,那是我凋零的心。
“一花一世界,一叶一菩提”,花树开花,原本就率性本真,从容不迫,来去自如,她留给自己的是落寞感伤,洒向人间的是绚美灿烂。为人为文,吐尽心思,点亮心灯,照彻人生,又何尝不是如此呢。
Matlab 函数之strfind, regexp
strfind用法 规定第二个参数类型只能是向量 不可以是cell 。
Syntax
- start = regexp(str,expr)
- [start,finish] = regexp(str,expr)
- [start,finish,tokens] = regexp(str,expr)
- [...] = regexp(str,expr,'once')
Description
start = regexp(str,expr) 返回一个向量,元素分别是表达式expr在字符串Str中的位置。表达式可以是:'c[aeiou]+t' (cat,caet, caoueouat)
当Str或者expr 是个元胞字符数组,regexp 返回 m-by-n元胞数组,其元素是向量,其中M是Str该字符串的指数,
http://www.weizmann.ac.il/matlab/techdoc/ref/regexp.html
数组里面的字符串轮流查找。
1从一组字符串里面,
string1={'42_time[ ]_', 'speed_vel', '002_air', 'water_005', 'att059[ ]', '895dps'}
查找下面几个字符串,
string0={'time', 'air','water'}
并且给出它们所在的列数。
*time 返回1
*air 返回3
*water 返回4
唉 看到cell就知道又是麻烦....
-
string1={'42_time[ ]_', 'speed_vel', '002_air', 'water_005', 'att059[ ]', '895dps'}
string0={'time', 'air','water'}; - for i=1:size(string0,2)
- s=regexp(string1,string0(i));
- weizhi=find(cellfun('isempty',s)==0);
- disp([weizhi string1(weizhi)])
- end
[1] '42_time[ ]_'
[3] '002_air'
[4] 'water_005'
- string1={'42_time[ ]_' ,'speed_vel' ,'002_air', 'water_005','att059[ ]','895dps'}
- string0={'time','air','water'}
- string1={'42_time[ ]_' ,'speed_vel' ,'002_air', 'water_005','att059[ ]','895dps'};
- string0={'time', 'air','water'};
- for i=1:size(string0,2)
- s=strfind(string1,string0{i});
- weizhi=find(cellfun('isempty',s)==0);
- disp([weizhi string1(weizhi)])
- end
注意string0{i}
结果一致
- [1] '42_time[ ]_'
- [3] '002_air'
- [4] 'water_005'
也可以用匿名函数
- string1={'42_time[ ]_' ,'speed_vel' ,'002_air', 'water_005','att059[ ]','895dps'};
- string0={'time', 'air','water'};
- f=@(x)find(~cellfun(@isempty,strfind(string1,x{:})));
- arrayfun(f,string0)
ans = 1 3 4
稍作修改:
- string1={'42_time[ ]_' ,'speed_vel' ,'002_air', 'water_005','att059[ ]','895dps'};
- string0={'time', 'air','water'};
- f=@(x)find(~cellfun(@isempty,strfind(string1,x))); % 将x{:}直接修改为x
- cellfun(f,string0) % 此时需要将arrayfun修改为cellfun
arrayfun和cellfun果然是强大啊
Matlab 随机数 小结
1,rand 生成均匀分布的伪随机数。分布在(0~1)之间
2,randn 生成标准正态分布的伪随机数(均值为0,方差为1)
3, randi 生成均匀分布的伪随机整数
如我的matlab在打开时输入以下命令将得到相同的随机数:
>> randn(3)
ans =
>> randn(3)
ans =
>> randn(3)
ans =
normrnd是自己可以指定均数和标准差的正态分布。
另外,Matlab随机数生成函数主要包括:
betarnd 贝塔分布的随机数生成器
binornd 二项分布的随机数生成器
chi2rnd 卡方分布的随机数生成器
exprnd 指数分布的随机数生成器
frnd f分布的随机数生成器
gamrnd 伽玛分布的随机数生成器
geornd 几何分布的随机数生成器
hygernd 超几何分布的随机数生成器
lognrnd 对数正态分布的随机数生成器
nbinrnd 负二项分布的随机数生成器
ncfrnd 非中心f分布的随机数生成器
nctrnd 非中心t分布的随机数生成器
ncx2rnd 非中心卡方分布的随机数生成器
normrnd 正态(高斯)分布的随机数生成器
poissrnd 泊松分布的随机数生成器
raylrnd 瑞利分布的随机数生成器
trnd 学生氏t分布的随机数生成器
unidrnd 离散均匀分布的随机数生成器
unifrnd 连续均匀分布的随机数生成器
weibrnd 威布尔分布的随机数生成器
人如天上的明月不可拥有
两次听小兔子提到给力的‘人如天上的明月不可拥有’,原来是李克勤的《月半小夜曲》的一句。
多情、痴情、准潇洒
月半小夜曲 李克勤
曲:河合奈保子 词:向雪怀
仍然倚在失眠夜望天边星宿
仍然听见小提琴如泣似诉再挑逗
为何只剩一弯月留在我的天空
这晚以后音讯隔绝
人如天上的明月是不可拥有
情如曲过只遗留无可挽救再分别
为何只是失望填密我的空虚
这晚夜没有吻别
仍在说永久想不到是借口
从未意会要分手
但我的心每分每刻仍然被她占有
她似这月儿仍然是不开口
提琴独奏独奏着明月半倚深秋
我的牵挂我的渴望 直至以后
http://v.youku.com/v_show/id_XMTIwMzc1ODg=.html
Matlab光标变黑块的问题
现象:编辑模式下,只能改写,不能插入。
问题:键了Insert键
另外word中如何出现类似问题,
从数学建模的思想来看人文学科的学习
前几天跟W聊过伊朗核问题中中国政府的表现。谈到最后涉及到两个新问题:Z介入程度,哲学、文化和国家前途命运。
从数学建模的思想来看,通过对本质问题的抽象,抓住矛盾的主要方面和主要目标。然后,确定准变量和假设条件,并优化目标。
其中,对本质问题的抽象,大多数采用的是对可变因素、确定因素的假设,并借助图形、符号的形式,呈现任务系统中各种因素之间的关联。而在这一切关系背后,必然有一个目标,在数模中被表达目标函数。
这也是学习数学,尤其是对于了解公式、图片背后的数学原理,的基本方法。而这一方法同样对人文学科同样适用。
从人文学科,包括经济和政治领域中,矛盾的主要方面,就是指other roles in the games,以及他们可能采取的游戏手段,包括贸易制裁、军事打击、行业制裁、经济封锁等。主要目标,也就是增强国家的综合国力,或者说现在的/未来的国家综合国力。如此一来,确定了这些基本要素之后,在国际政治中,其实很容易理解ZF之前的很多举措,包括之前东太平洋对菲、越南小国的忍让,以及现在对伊朗核问题的态度,以及08年美元大跌,中俄推欧元。
关于世界模型的终极统一
无论是人文科学,还是自然科学,无论是某一领域的泰山北斗,还是集大成者,都期望自己的见解和观点,能够解释并预测所有的现象和事物。比如,王阳明的观点,概括来讲,理论部分就是“反求诸己,知行合一”,辅助原则就是坚持良心和理想,再比如爱因斯坦的光的波粒二象性。
这样的见解和观点,其实就是一种观点和模型。
下一期:
是世界多核,还是少数大国拥有核,哪个更容易产生世界和平?
Data Visualization and Infographics Resources(Transferred)
-
Data visualizations and infographics can make complex datasets easier to understand and comprehend. By creating a graphical represenatation of data and statistics, complicated concepts and information can make more sense in less time.
Many visualizations focus on representing a specific set of data or statistical information. Others focus on less-concrete topics, providing a visual representation of abstract concepts. Generally speaking, the first type appear more like graphs or charts and the latter are often more creative and imaginative.
But visualizations and infographics can be used poorly, too. Putting in too much information (or not enough), using improper formats for the information provided, and other failures are common. Below are more than 25 useful resources for infographics and data visualization. Most are galleries of effective graphics though some also provide how-to information for information designers.
Also consider our previous articles:
1. Data Visualization Sites
Here are some blogs and website that provide great information for information designers, including how-to articles, visualization showcases and galleries, and other resources. Some even include tools for creating your own visualizations.
Strange Maps
Strange Maps 7 features only map-based graphics, both modern and historical. The commentary accompanying the maps is what really makes the site interesting, especially on the historic maps.
 8
8 9
9 10
10Wall Stats
Wall Stats 11 includes original infographics depicting discretionary spending in the United States. The graphics are also available in poster form. They also provide coverage of other infographics about political and economic topics.
 12
12 13
13Visual Complexity
Visual Complexity 14 – This site showcases infographics and data visualizations from a wide variety of sources and has nearly 700 projects included. Graphics are categorized to make finding specific projects easier and plenty of information is included about each image.
 15
15 16
16 17
17Cool Infographics
Cool Infographics 18 is an awesome blog that chronicles infographics and data visualizations from all over the web. They cover almost every topic you could think of. Posts are tagged to make it easier to find the specific kinds of graphics you’re looking for.
 19
19 20
20 21
21Data Mining
Data Mining 22 is a blog that covers data visualization, social media and data mining. They aggregate tons of infographics from other sites, including National Geographic and The Economist.
 23
23 24
24Edward Tufte
This site 25 presents a wide variety of infographics from multiple sources interspersed with other images. The commentary about the graphics is what sets it apart, and there are some incredibly interesting images included.
 26
26 27
27Infographics News
Infographics News 28 is dedicated primarily to news infographics. They also cover news related to data visualization and unusual infographics.
 29
29 30
30Information Aesthetics
Information Aesthetics 31 is a blog that details beautiful infographics and data visualizations from all over the web. Grahpics featured include political, financial and econimic, and other visualizations, dating as far back as December 2004.
 32
32 33
33Chart Porn
Chart Porn 34 features charts and graphs from all over the web, all beautifully designed and covering a wide variety of topics. Posts are categorized by topic and source to make it easier to find specific charts.
 35
35 36
36 37
37Behance Network
The Behance Network 38 has tags for Information Architecture and specifically for infographics. They have dozens of graphics in either category from a selection of graphic artists.
 39
39 40
40Good Magazine
Good Magazine 41 presents some of the most interesting original infographics out there. They’ve created infographics on everything from water issues to the growth of food stamps to Obama’s effect on voter turnout.
 42
42 43
43 44
44Matthew Ericson
The blog 45 of infographic designer Matthew Ericson that includes visualizations created by others as well as himself. Recently featured visualizations include a map of murders in New York City and an industrial production data visualization.
 46
46 47
47NiXLOG Infographics
NiXLOG 48 has a great infographics section that includes an aggregation of infographics from all over the web. There’s also an original infographic of the evolution of Apple computers and their adoption by consumers.
 49
49 50
50Virtual Water
Virtual Water 51 is a specialized blog covering the usage of the virtual water content infographic poster and the information it contains. They provide the info from the poster as well as links to publications that have used it (in whole or in part) and other infographic-related content.
 52
52 53
53History Shots
History Shots 54 is a commercial site that sells infographic and visualization products (posters, notecards, etc.) for a variety of topics. Most of their images focus on historic events, time periods and subjects and you can browse based on political, military, sports, or general graphics. It’s an incredibly interesting site and you can zoom into the graphics shown to read them onscreen.
 55
55 56
56 57
57Flowing Data
Flowing Data 58 offers up some amazing infographics and visualizations, with their own dedicated category. They’ve covered the best beer in the U.S., wine personality profiles, the Kennedy family tree, and the religious geography of the United States, among tons of other awesome graphics.
 59
59 60
60 61
61Many Eyes
Many Eyes 62 is a data visualization site that offers tools for creating your own visualizations as well as for browsing infographics created by others. There are already thousands of visualizations included on the site.
 63
63 64
64 65
65The New York Times
While you’ll have to search around a bit to find the best infographics on The New York Times 66 site, it’s definitely worth the effort. They have some of the best infographics in the business representing and breaking down really complex data sets so their average reader can easily understand what’s actually going on.
 67
67 68
68 69
69Nicolasrapp.com
nicolasrapp.com 70 is an information design blog that covers primarily the infographics and data visualizations the author creates for The Associated Press.
 71
71 72
72 73
73DataViz
DataViz 74 showcases images of beautiful data visualizations from all over the web. No commentary is included, but the images really speak for themselves.
 75
75 76
76 77
77iGraphics Explained
iGraphics Explained 78 – This blog aims to shed some light on the world of infographics and data visualizations by explaining their effectiveness and how they were done. They showcase some beautiful graphics from sources all over the internet, so it’s a great place to go for inspiration and to see what kinds of graphics work and which kinds don’t.
 79
79 80
80 81
81Simple Complexity
Simple Complexity 82 – This site showcases data visualizations that take complex data sets and display them in an easier-to-understand format that can help make sense of their true meaning. They showcase infographics from all over the net, as well as posting some how-to articles on creating better infographics.
 83
83 84
84 85
85Well-formed Data
Well-formed Data 86 – This blog covers interface design, infographics and data visualizations, and statistics in general. The commentary accompanying the graphics is especially interesting, often delving deeper into the topics the visualizations cover.
 87
87 88
88Information is Beautiful
Information Is Beautiful 89 – This blog celebrates beautiful information design, infographics, and data visualizations. They cover a wide variety of topics, create their own visualizations, and showcase those designed by others.
 90
90 91
91 92
923. Flickr Pools for Infographics
Flickr pools can be a great source of information and inspiration. The ones featured below are dedicated to infographics and data visualizations, and most include examples from all over the world and a variety of different eras. They’re an excellent place to go to get ideas or see what infographics trends are around the globe.
Infografia | Infographics 93 – A pool with more than 700 infographic images, posted by 120+ members.
 94
94 95
95 96
96Infografistas.com / Infographics News 97 – This pool has nearly 350 items posted, all data visualizations and infographics from a huge variety of sources.
 98
98 99
99 100
100Visual Information 101 – A pool with nearly 650 items posted. There are visualizations for everything from restaurant spending to library maps.
 102
102 103
103 104
104The Info Graphics Pool 105 – This seems to be the largest Flickr pool dedicated to infographics and data visualizations, with more than 700 members and 1800+ items included.
 106
106 107
107 108
108- Data Visualizations and Infographics 5 which lists examples and types of infographics and data visualizations.
- Data Visualization: Modern Approaches 6 showcases modern examples of data visualization and infographics.
推荐一些网站:
http://www.dailymotion.com/video/xjmp1_royksopp-remind-me_music
http://www.flickr.com/photos/ffranchi/collections/72157620676924153/
3D visualization of tremendous information, Do miss Topicscape:
http://www.topicscape.com
Visual Loop (http://visualoop.tumblr.com/
U r the apply of my eye 后感
小兔子一直在我耳边述说着这部片子的唯美与真实。终于周六跟小兔子一起看《那些年,我们一起追的女孩》,只能说:真是一部非常好的电影!这也是2012年看到的第一部有意思的电影。
让我想起,高中那会儿没有那么强烈、那么完美的追过,却也有过心思暗涌、愉快并纠结,充满活力而又懵懂的时光。既是单纯地去喜欢,希望能让她永远幸福快乐,又希望她在永远你身边。
谁不曾幼稚?谁能担保以后永远不再幼稚?
幼稚是因为只有纯正与友爱,不羁与单纯,真实和勇敢。。。。
幼稚就是为了她的开心,而努力去尝试做自己不想做、害怕做的事情,并且努力做好。
不曾跟你有很多过去,但求在回忆我们的青春的时候,你能够说,仔仔,谢谢这么多年,你一直让我有恋爱的感觉。哈哈
台词:
人生很多事都是徒劳无功的
会读书的人很厉害 (这话在高三的时候我肯定不会这么认为)
恋爱最美好的时光是暧昧的时候
“成长最残酷的部分就是,女孩永远比同年龄的男孩成熟。就是这种成熟,让男孩招架不住。”
这也许就是残酷青春的真谛了,当你能够应付那些成熟的女孩,并且不再受伤的时候,你就已经告别了青春。
他会为了你发奋读书,但却有点笨,总是不懂女生真正的想法。如电影所说,女生的思想总是比男生更早的成熟。她很喜欢用笔戳你后背,她喜欢说你幼稚,因为她喜欢你,即使你们是不同的世界的人。你是坏学生,她是好学生。
他是坏学生,但是为了自己喜欢的女生,竟然也开始发奋读书,大半夜的读英语,一下子蹦到了第二的好成绩,或许他们不知道是什么原因,或许他们本来就知道。
她是好学生,但是偶尔也很强悍的客串了坏学生,尽管最后不淡定的在那哭得稀里哗啦的。
然后大家上了不同的列车,我们的青春,终究是什么都不剩。
故事的结局很现实,她结婚了,身边自然不是几年前的那个她。有时候会想,假如~~~或许一切都不会不同,但如此,又不是青春了,青春本来就是充满了各种遗憾,所以才令人无限向往。
或许遗憾也是一种美,只是如同女主角一样,偶尔会想起你,想起自己的high school,想起每天清晨楼梯口狂奔的相遇,想起某些日子,你出乎意料的第一然后我第二。想起你为了我,和你的兄弟说不要打扰我。
想起~~~然后傻笑,然后心里有种莫名的情愫。
有人说,看完电影,很遗憾在高中时代没有过这样的回忆。那么我是不是幸运的,至少,在那个单调的时光里,有一个柯景腾,让一切变得不一样。
然后~“You are always the apple of my eye.”柯景腾把苹果吃掉了。
“新婚快乐,我的青春”
这就是人生。
大学第一次圣诞节,漫步在火车轨道上,女孩问男孩:“你真的喜欢我吗?”男孩说:“喜欢啊。”女孩说:“我总觉得,你把我想的太好了。我根本没有你想的那么好……说不定,你喜欢上的,只是你想象出来的我。”看完之后,觉得女孩这样的想法非常有道理。少年时感情总是那样的单纯和美好,是因为我们用尽一切办法去保护它,我们不愿意让它沾染任何杂质,因为它在我们的心里那样神圣,只要有一个我爱的你,有我自己,就足够了。这或许也是为什么在最后放飞许愿灯的时候,男孩并没有让女孩说出答案,一方面,他怕答案是拒绝,另一方面,他是怕这份喜欢不再是心里那份喜欢。所以他说:“拜托不要现在告诉我,请让我,继续喜欢你。”
时不我待
开始慢慢理解和欣赏兔子的时候,我建立了这个新的博客。只是记录此间的下乡插队的日子,有你在侧的日子。
路过Mercedes Benz Arena的时候,我想起了《非诚勿扰》有一期节目,男嘉宾对他心爱的女孩说,我将来要设计一辆车,以你的名字来命名。我没有这样的宏大理想。但我希望,以后所有生活、学习、工作,和共有的一份事业,以你为中心,以我们的未来为中心。
努力工作,才能回报你对我的信任,才能回报你对我的深深的爱,才能成为你比较欣赏的那个我。
努力使你对你的选择感到值得。
只有勤奋努力,才能对得起你的真情!
更多的2011总结,必须在论文结束之后进行。
写在岁末
2011.12.31 @ IIGS
kalmanfans
搜索
日历
| 二月 | ||||||
|---|---|---|---|---|---|---|
| 日 | 一 | 二 | 三 | 四 | 五 | 六 |
| 26 | 27 | 28 | 29 | 30 | 31 | 1 |
| 2 | 3 | 4 | 5 | 6 | 7 | 8 |
| 9 | 10 | 11 | 12 | 13 | 14 | 15 |
| 16 | 17 | 18 | 19 | 20 | 21 | 22 |
| 23 | 24 | 25 | 26 | 27 | 28 | 1 |
分类
- ArcGIS
- Matlab
- Fortan
- Software application
- 爱你爱家
- Data Visualization
- Telematics Transport
- Kalman Filter, Monte Carlo, ANN
- Network Analysis
- Location Based Service LBS
- Office TOY & Funing Puzzle
- Mathematical Modeling
- 建筑 规划 设计
- 在德意志插队的日子
- Culture Philosophy
- ways to research
- 电影 音乐
- 每周一则新闻
- Bernese
- Quantum mechanics
- 数据库