Matlab Legend插入部分图形句柄
摘要:
由于之前有一个安排上的错误,使用Matlab绘图时采用的,输出数据立即绘制到图形上。以至于在使用Legend插入图例时,插入了上千个图例,其中图形相同的图例重复。
通过其他软件(如PPT)去额外添加图例,又不能得到比较高质量DPI的图片。
受下面的程序所启发,通过Legend本身作文章,解决了问题。
b = bar(rand(10,5),'stacked'); colormap(summer); hold on
x = plot(1:10,5*rand(10,1),'marker','square','markersize',12,...
'markeredgecolor','y','markerfacecolor',[.6 0 .6], 'linestyle','-','color','r','linewidth',2);
hold off;
legend([b,x],'Carrots','Peas','Peppers','Green Beans', 'Cucumbers','Eggplant');
通过图例能得知,legend 函数可以以需要作为图例的函数作为输入,如图中的[b,x]就是需要作为图例的函数。
其中,b,x都是图形句柄(这是Matlab的图形表达)。
笔者的解决方法是:
把需要作为图例而绘制的函数,选择其中一个(一般选择第一个,或者最后一个,以便于循环处理),并以句柄表明(如下面程序中的GSM_cell_boundary, stra_Tra, fp_Star )。
% extract the samples of legend elements above
legend_main = [GSM_cell_boundary, stra_Tra, fp_Star]
xlabel(xlabel_text)
ylabel(ylabel_text)
title(title_text)
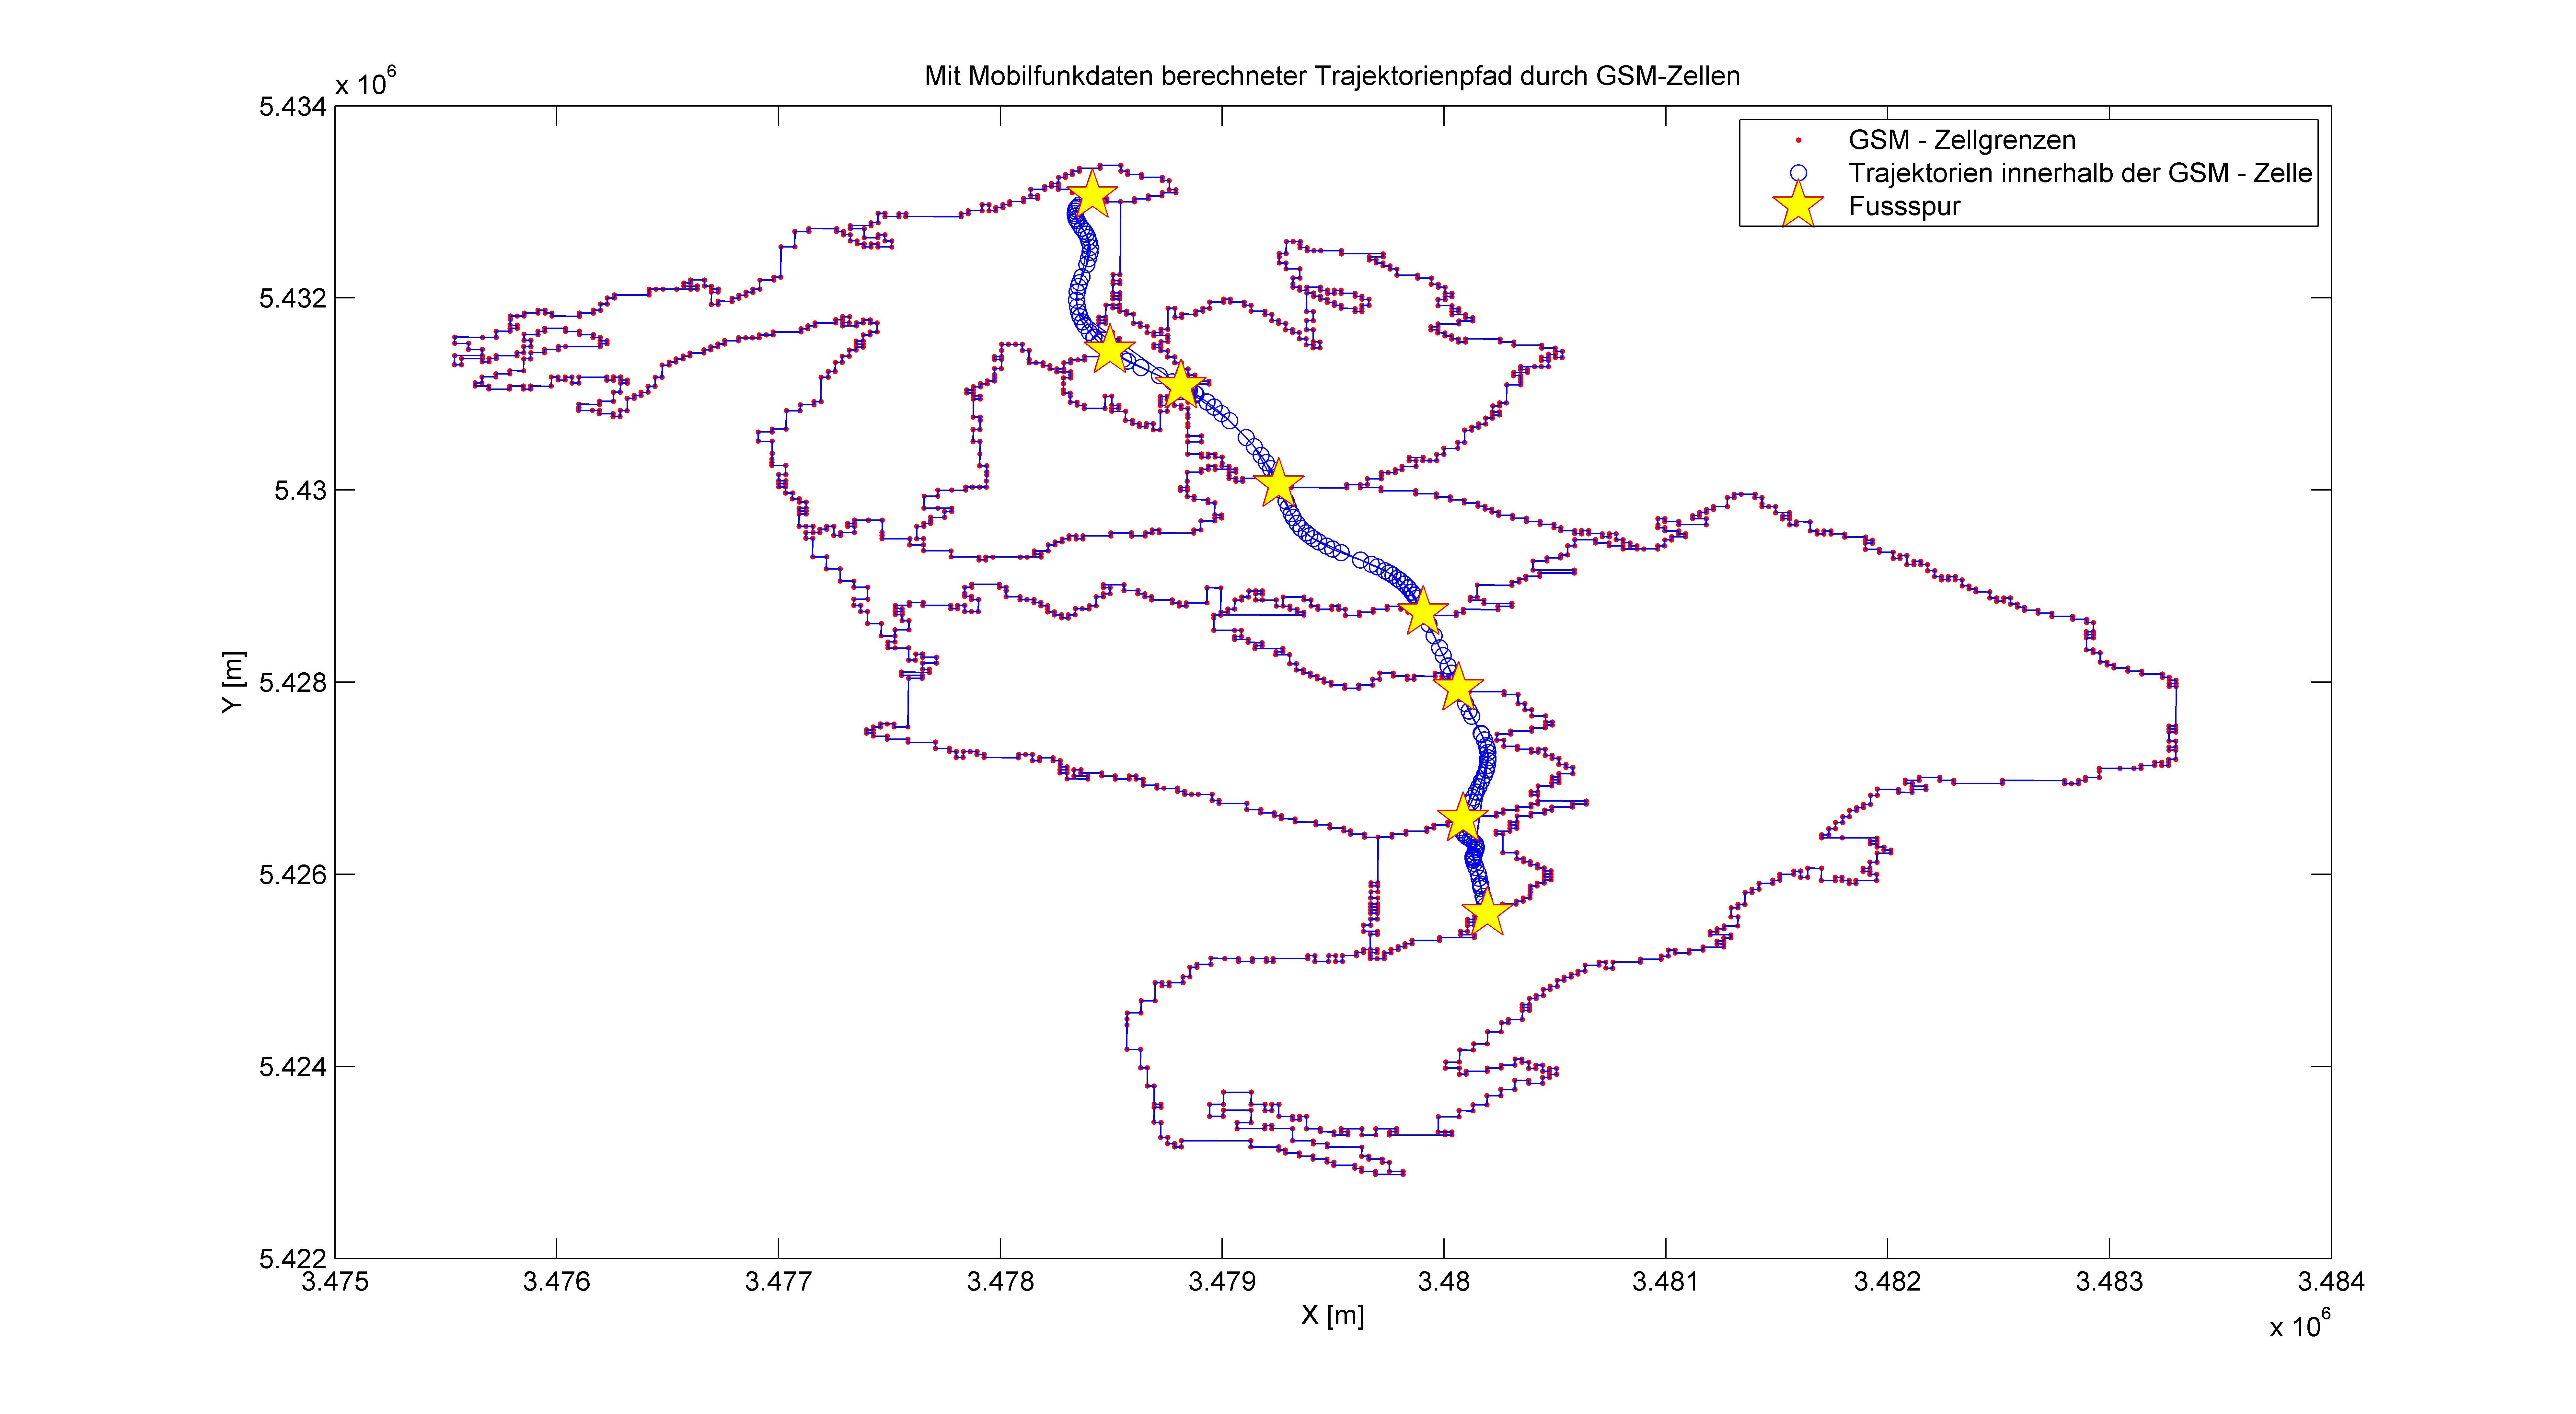
legend(legend_main, 'GSM - Zellgrenzen','Trajektorien innerhalb der GSM - Zelle','Fussspur', 'Location','NorthEast');
% legend(legend_main, 'Boundary of the GSM Cell','Part of trajectory in the GSM Cell','Footprint', 'Location','NorthEast');
然后使用Legend的常规方法,绘制图例即可。
仍有不明白之处,请Email: shchen.lmars@live.cn
 评论 (0)
kalmanfans
搜索
日历
| 五月 | ||||||
|---|---|---|---|---|---|---|
| 日 | 一 | 二 | 三 | 四 | 五 | 六 |
| 27 | 28 | 29 | 30 | 1 | 2 | 3 |
| 4 | 5 | 6 | 7 | 8 | 9 | 10 |
| 11 | 12 | 13 | 14 | 15 | 16 | 17 |
| 18 | 19 | 20 | 21 | 22 | 23 | 24 |
| 25 | 26 | 27 | 28 | 29 | 30 | 31 |
分类
- ArcGIS
- Matlab
- Fortan
- Software application
- 爱你爱家
- Data Visualization
- Telematics Transport
- Kalman Filter, Monte Carlo, ANN
- Network Analysis
- Location Based Service LBS
- Office TOY & Funing Puzzle
- Mathematical Modeling
- 建筑 规划 设计
- 在德意志插队的日子
- Culture Philosophy
- ways to research
- 电影 音乐
- 每周一则新闻
- Bernese
- Quantum mechanics
- 数据库